How I Built a LAN Honeypot to Spot Questionable Activity
I gave curious clients on my network somewhere to connect, then recorded what they did. Four decoy services feed one event history and a dashboard I can investigate.
I wanted to know when something on my LAN started exploring services it had no ordinary reason to use. A device can be connected to my network and still deserve a closer look. A new connection, a guessed password, or a request for an administration page gives me something concrete to investigate.
I built LAN Observatory to collect that evidence. It presents a few deliberately inviting services, records interactions, and lets me follow a connection from its first bytes through authentication, commands, and closure.
This is a honeypot: a set of decoy services whose use is itself interesting. It does not decide that every visitor is malicious. A discovery tool, an inventory agent, or my own testing can touch the same ports. The point is to make those interactions visible enough to ask why they happened.
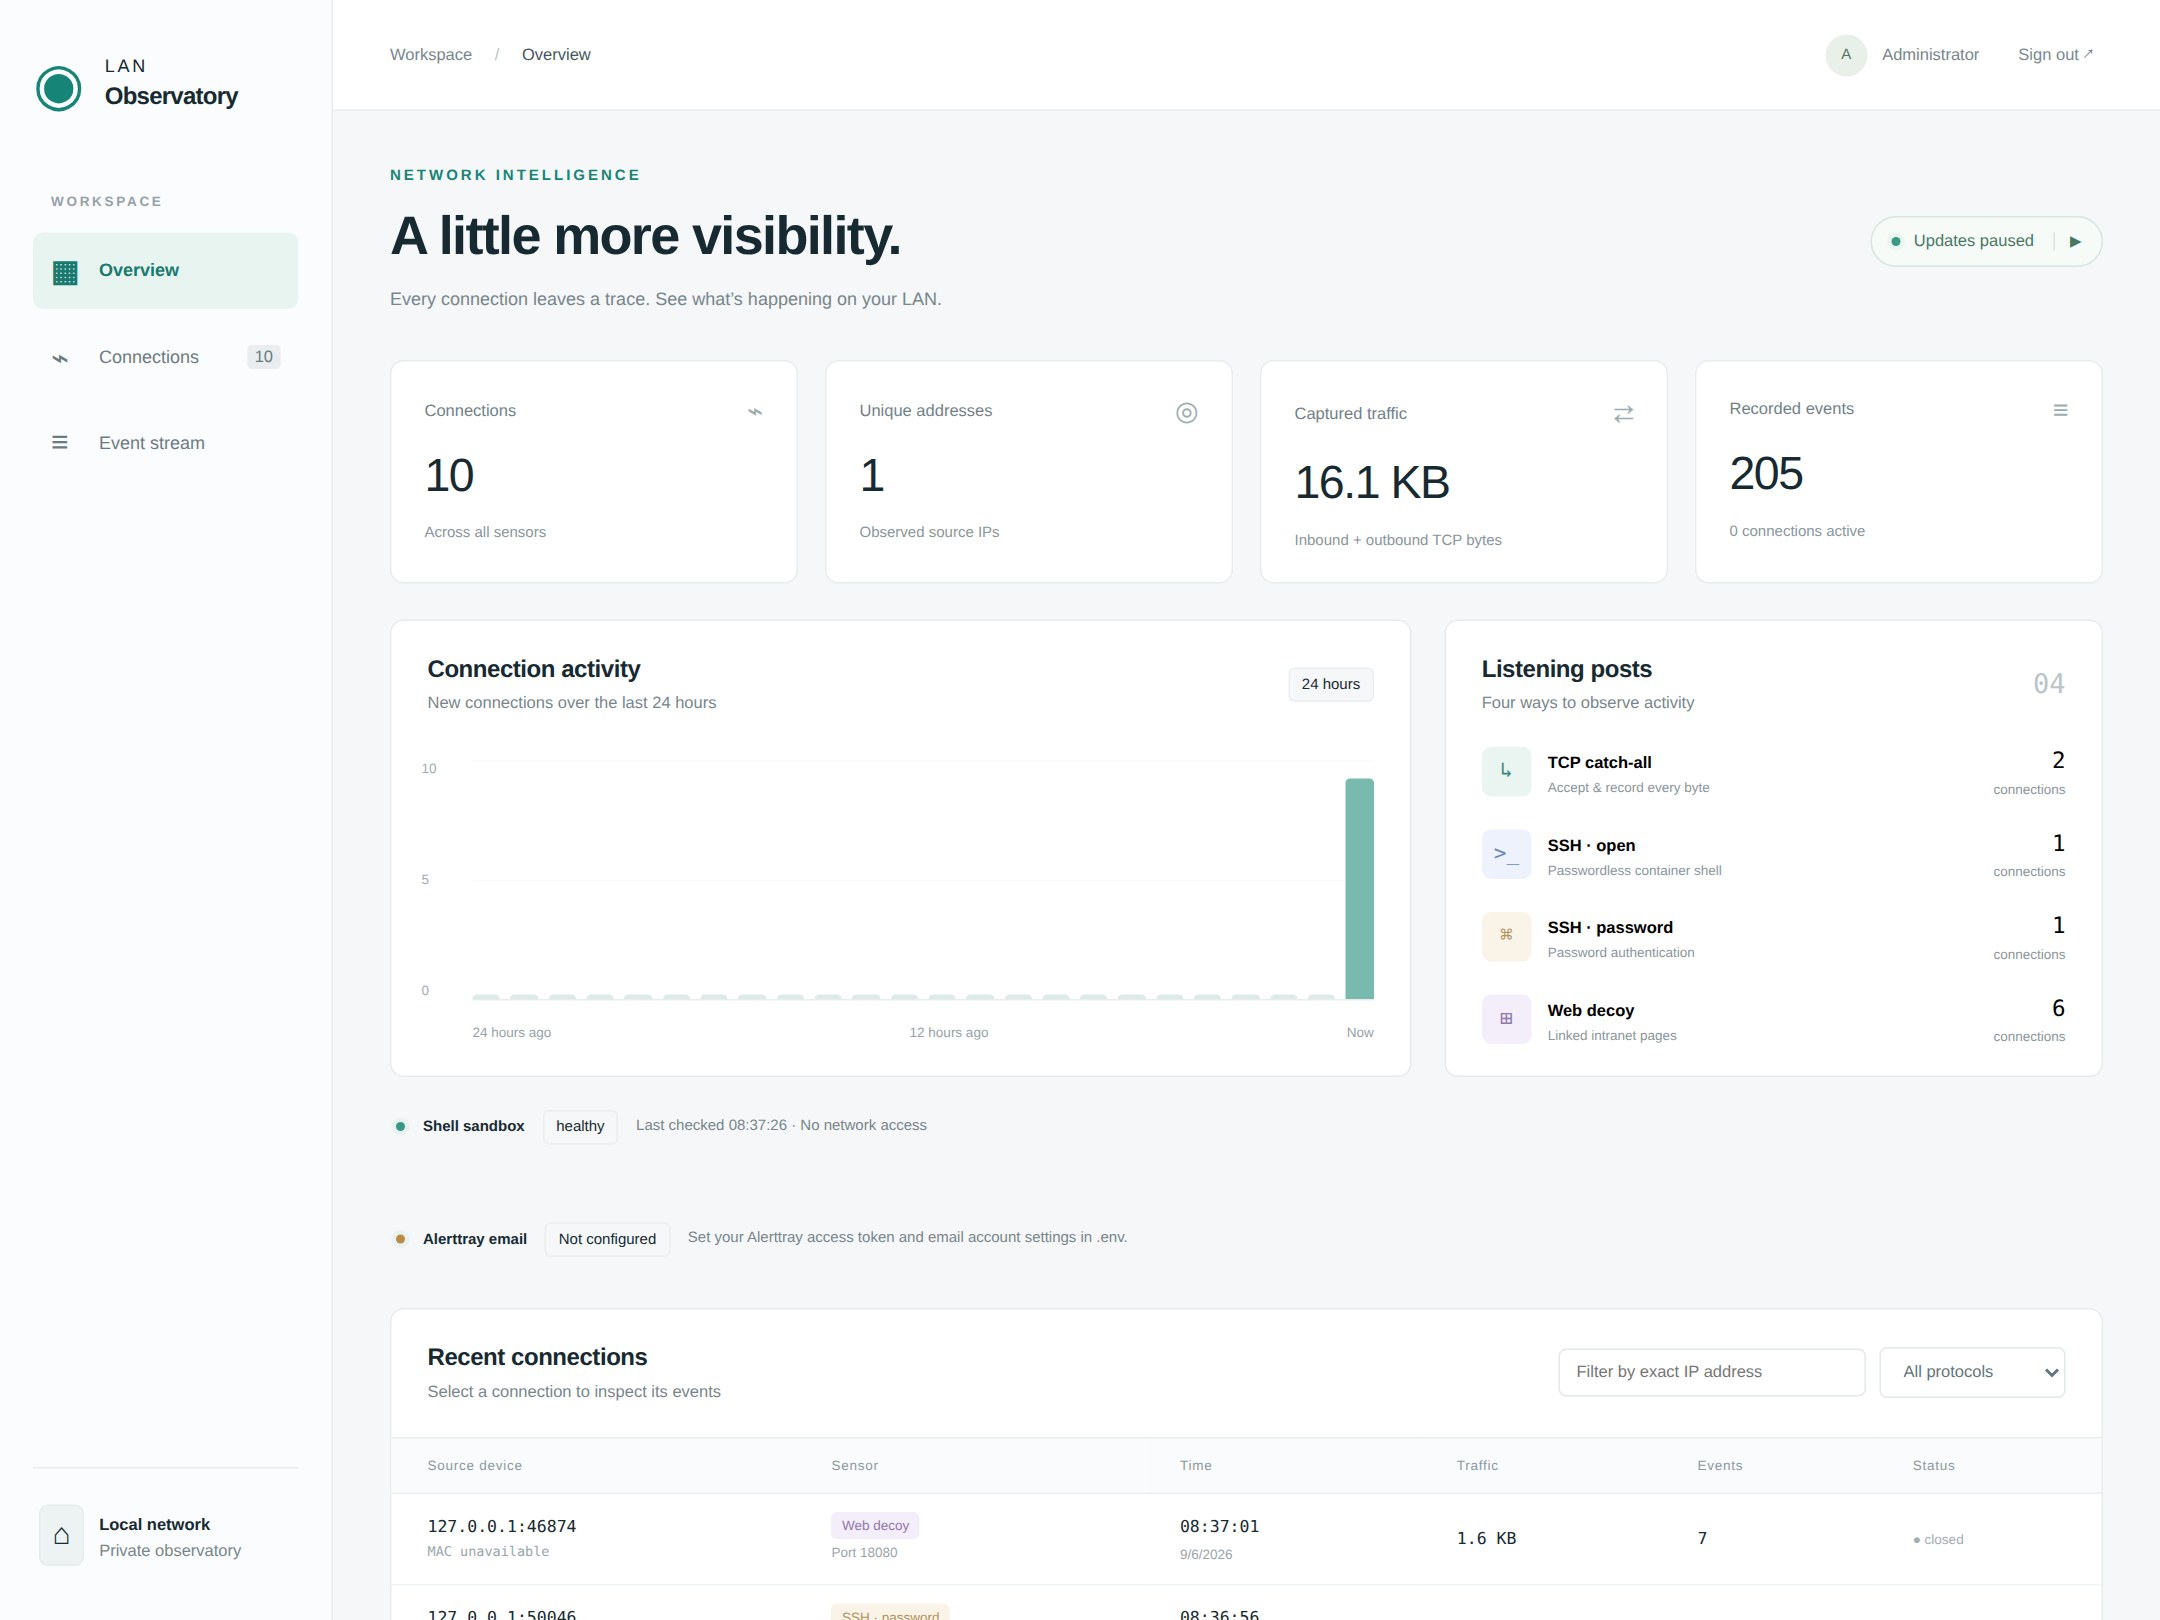
Four listening posts on one machine
I used a Python collector to own all four decoy listeners in one process. Each offers a different reason for a curious client to interact:
| Default port | Decoy | What it observes |
|---|---|---|
| 9000 | TCP catch-all | Connections and arbitrary binary input after an OK banner. |
| 2222 | Open SSH | An SSH session accepting none authentication, then shell or command requests. |
| 2223 | Password SSH | Authentication attempts; the deliberate decoy password is password. |
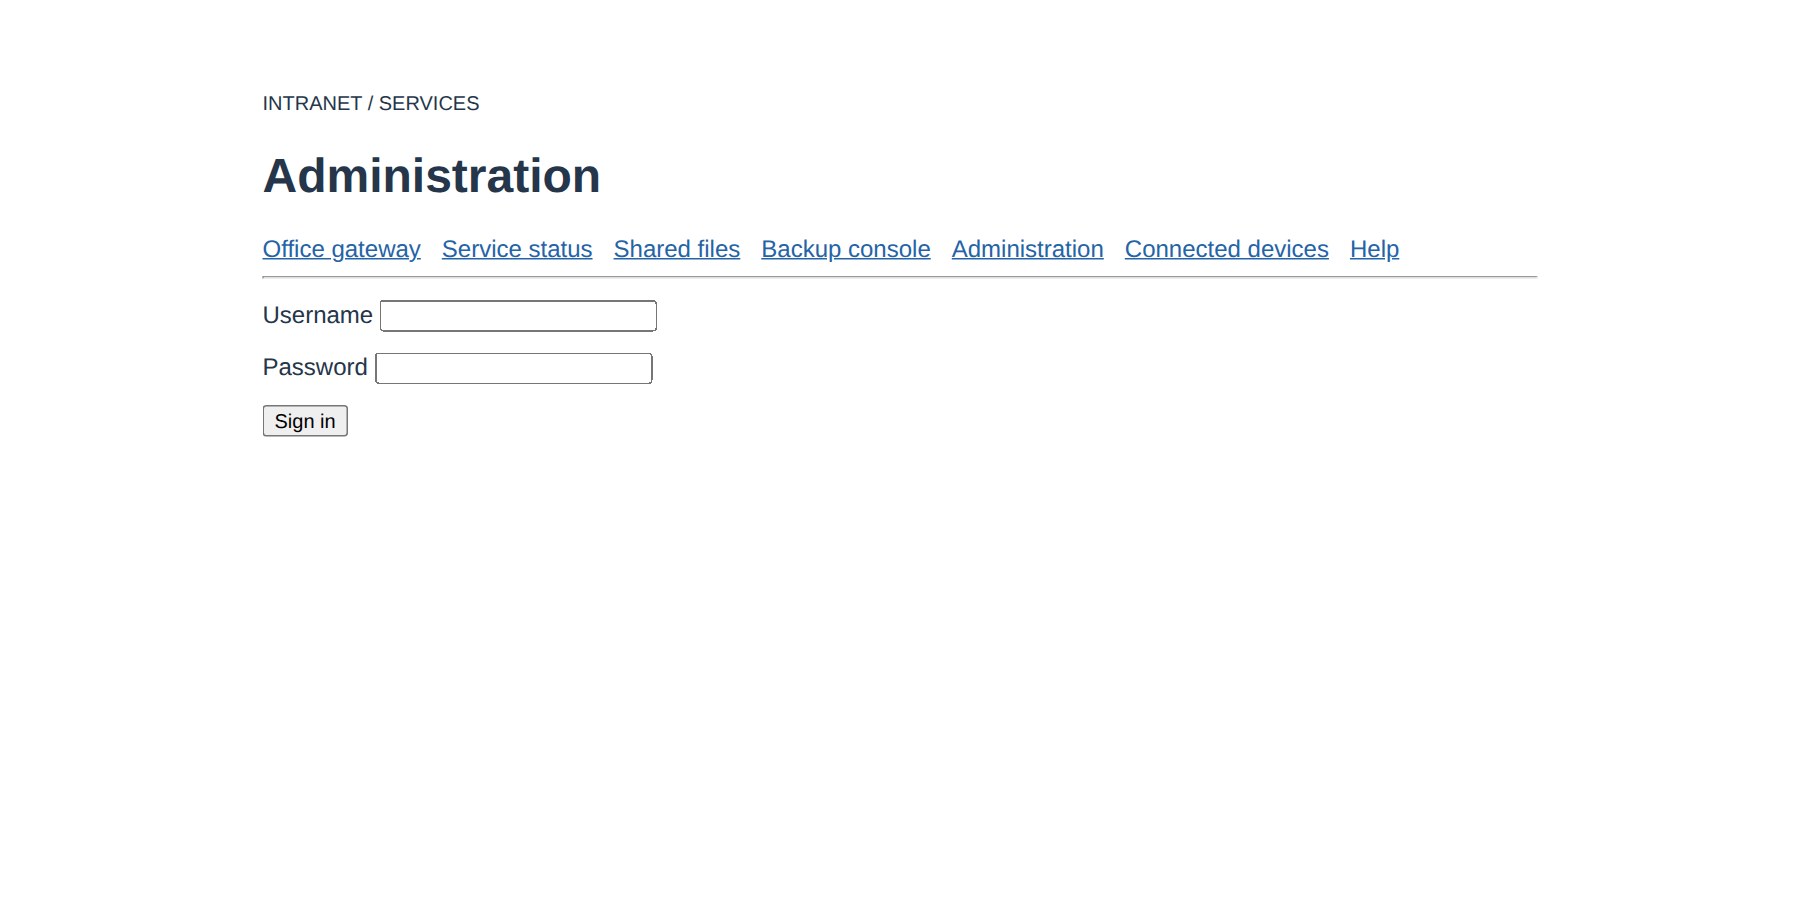
| 8080 | Web decoy | Requests to linked intranet pages, forms, files, and administration pages. |
The real dashboard is separate, on port 3000 by default, with its own administrator password. The collector’s command/query API defaults to loopback on port 9100. A password that works on the SSH decoy does not grant dashboard access.
For a LAN deployment, I bind HONEYPOT_HOST to the intended interface and keep inbound access limited to that network. There is no router port-forwarding requirement. The observation point is inside the network, where unexpected lateral exploration is the thing I want to notice.
Make the SSH interaction real, then contain it
A fake SSH banner only tells me that someone connected. Here, the collector terminates the real SSH protocol with Paramiko. It can record authentication attempts and accept an interactive shell or an exec request, which gives the session somewhere to go.
The command runs in an Alpine/BusyBox Docker sandbox as user 10001:10001. The sandbox has no network access, no host bind mounts, a read-only root filesystem, dropped Linux capabilities, and no-new-privileges enabled. Writable temporary directories are limited tmpfs mounts. Memory, CPU, process count, and session duration are bounded.
The collector refuses forwarding, SFTP, agent forwarding, X11, and client environment changes, and records those refusals. The Docker socket stays on the host side of the boundary. It is not mounted into the decoy shell.
This still needs a carefully maintained host: the collector and processor can access Docker, and the sandbox shares the host kernel. Sessions also share the same sandbox, so temporary changes made by one session can be visible to another. It is a constrained place to observe commands, not a separate virtual machine for every connection.
Store observations before interpreting them
I used the same command/event/read-model separation I use in other applications. Protocol adapters report observations to command handlers. Those handlers append events and update query tables in one SQLite transaction. The dashboard reads the resulting views through an authenticated API.
ConnectionOpened
  → BytesCaptured
  → AuthenticationAttempted
  → SshCommandRequested
  → ContainerSessionStarted
  → TerminalBytesCaptured
  → ContainerSessionEnded
  → ConnectionClosed
That is an example path through an SSH interaction. The actual stream also contains lower-level SSH packets and transport bytes. HTTP produces its own request, body, trailer, and response events. Raw payloads are stored as SQLite BLOBs, with sequence numbers, session identifiers, metadata, digests, and a chained event hash.
The original bytes matter. A decoded summary is useful for browsing, but it should not be the only record of a malformed request or binary probe. The interface provides text and hex previews plus exact payload downloads. Captured text is rendered as text, so a web request containing markup does not become executable dashboard HTML.
The event history also lets me rebuild the read models. Replaying events reconstructs the query tables without repeating Docker actions or sending notifications. The project’s event model documents those boundaries.
From a connection to the command it ran
The dashboard starts with connection counts, observed source addresses, captured traffic, a timeline, and a breakdown by sensor. I can filter by IP address or protocol, select one connection, and inspect its event stream.
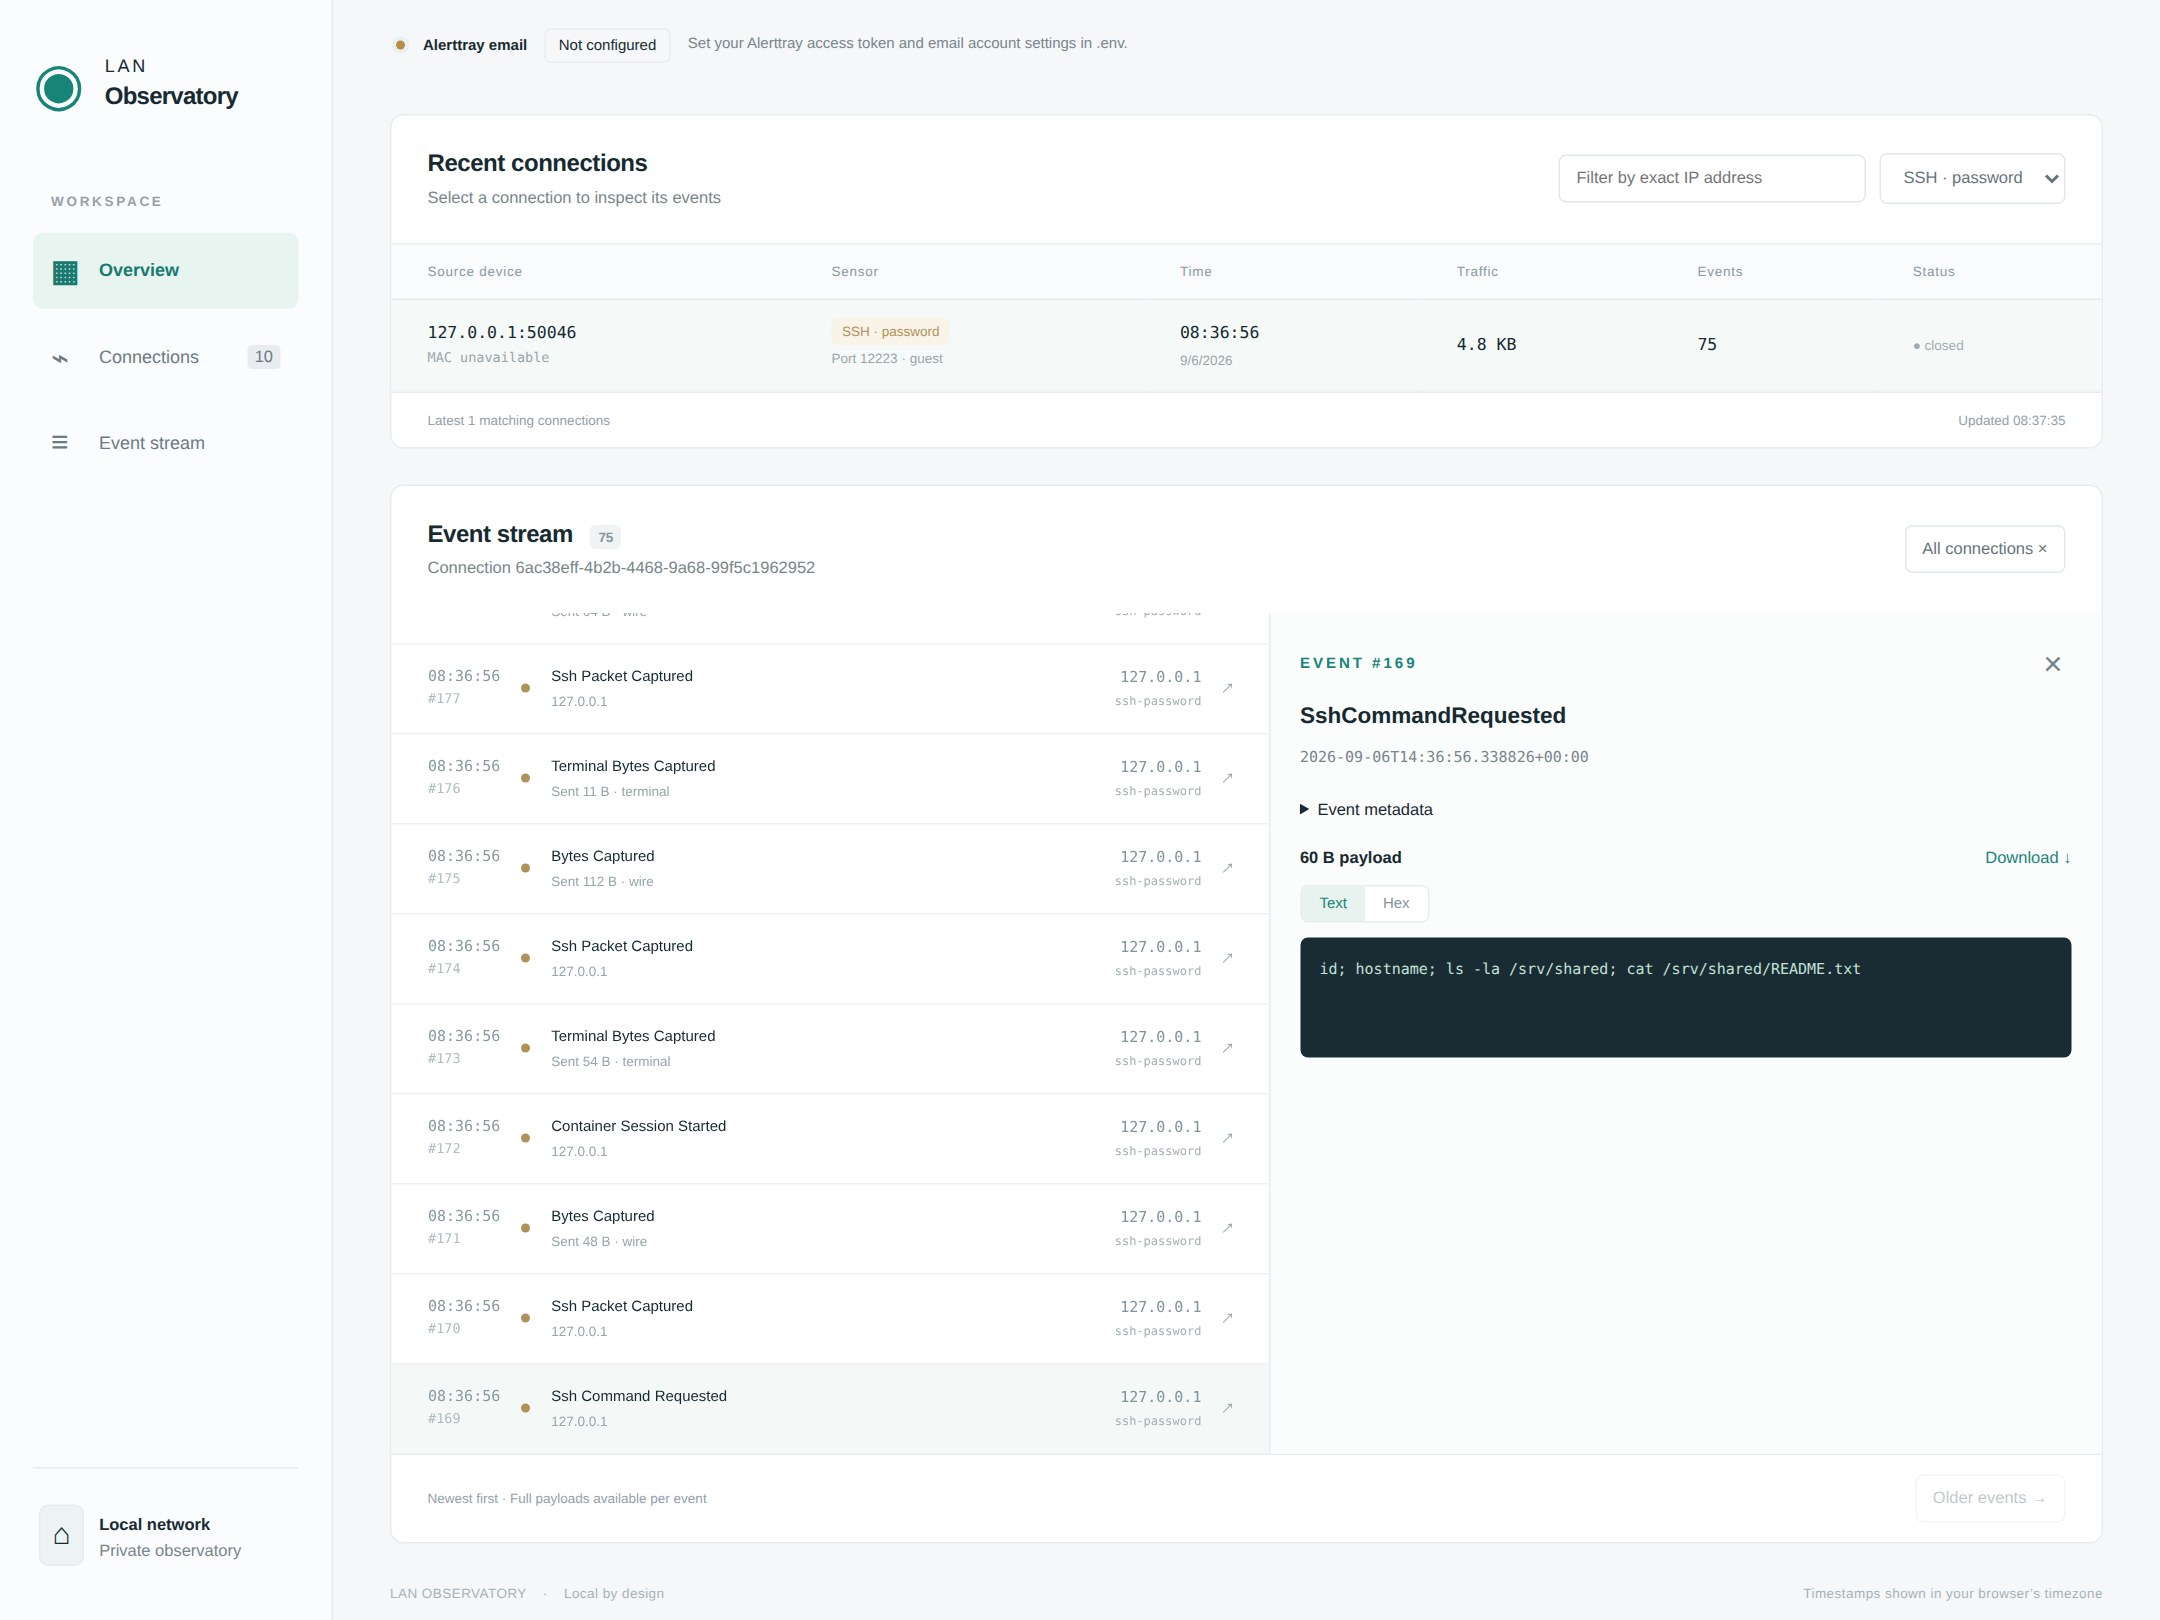
For this article, I sent binary data to the TCP listener, browsed the decoy, submitted a form with clearly fake credentials, and connected to both SSH services. On the password listener, I tried an incorrect password before the deliberate password credential. The first attempt was rejected and the second accepted.
The SSH probe then ran this command inside the container:
id; hostname; ls -la /srv/shared; cat /srv/shared/README.txtThe output confirmed user ID 10001 and showed the sandbox’s sample shared directory. Those requests went through real sockets and Docker exec; the screenshots were captured from the running app rather than assembled from mock dashboard data.
On a real LAN, I would use the same workflow to investigate repeated password attempts, unexpected shell commands, or a client walking through decoy administration and file pages. I would compare the source with my device inventory and scheduled jobs before treating it as a compromise.
Keep the sandbox running with a processor
The background processor queries for pending container work, inspects Docker, and creates, starts, or restarts the application’s sandbox as needed. It reports the outcome back as a command. It never opens the event database directly.
The dashboard has a separate read-only query identity. Its server proxies an allowlist of query routes after checking the browser session, so the browser never receives the collector’s internal credentials.
The local working copy also includes an optional Alerttray integration that batches new connection summaries. Its notification outbox and retry outcomes are recorded as events. I left notification sending disabled during this demonstration. An API acceptance receipt is distinct from confirmed email delivery, and that feature should be configured and verified separately.
Running it exposed a useful build problem
The project needs Python, Node.js, Docker, and the Linux networking tools. Its setup creates the Python environment, installs dependencies, generates local credentials, builds the sandbox, and starts the collector, processor, and dashboard:
python3 -m venv .venv
.venv/bin/pip install -r requirements.txt
npm ci --prefix nextjs-app

# Generate credentials only on a fresh checkout.
python3 scripts/configure.py

docker build -t lan-telemetry-sandbox:local sandbox
npm run build --prefix nextjs-app
.venv/bin/python scripts/run.py
When I ran the checkout for these screenshots, the image build failed because Alpine 3.23 already included a guest user. I fixed the local Dockerfile to remove that pre-existing account before creating the intended UID/GID 10001 account. The sandbox then built and ran successfully.
I also ran the repository’s integration smoke test. It passed real TCP, both SSH authentication modes, container exec and PTY interaction, HTTP, recovery after stopping the sandbox, projection replay, and verification of 235 event hashes in that test run.
# After building the sandbox image:
.venv/bin/python scripts/smoke.py
The demonstration used a temporary database, loopback-only listeners, and a disposable sandbox. That gives me repeatable screenshots without mixing test sessions into the LAN’s observation history.
What this can tell me—and what it cannot
This collector sees application-visible traffic that reaches its listeners. It does not watch every conversation on the LAN. SYN-only scans, rejected packets, Ethernet headers, retransmissions, and traffic between other devices are outside its capture.
MAC attribution is best effort from the host’s neighbor table. A missing MAC stays missing, and an observed address is not a verified device identity. The dashboard’s unique-address count should not be mistaken for a definitive device inventory.
There are practical storage limits too. Events are not automatically deleted. The collector applies connection, byte, duration, and free-space limits, but the database still needs monitoring and backups. Decoy credentials and request bodies are intentionally captured, so access to the event history is access to that material.
The hash chain helps identify inconsistent changes when compared with a trusted earlier head hash. It does not prevent someone with full database write access from rewriting the history and recalculating hashes.
What I get is a useful starting point for investigation: which address connected, what it tried, what the decoy returned, and what happened next. The source is on GitHub, including the capture code, sandbox policy, dashboard, and smoke test.